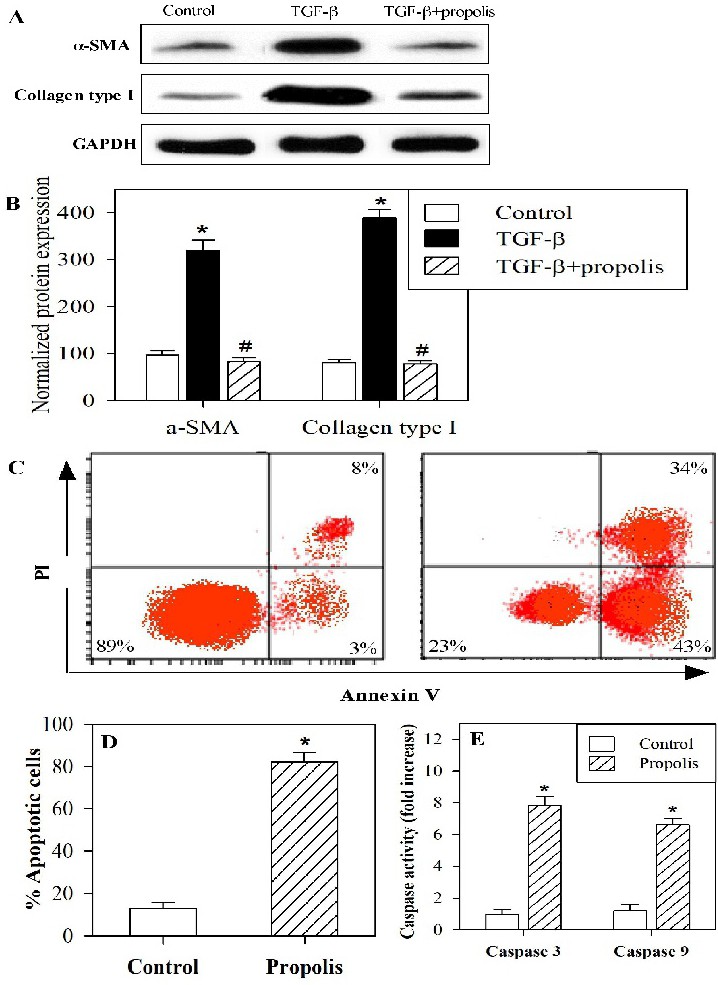
Fig. 6. Propolis decreased the expression of myofibroblastic markers in hepatic stellate cell-T6. Expression of α-SMA and collagen type Ⅰ was detected in the HSC-T6 cell line using Western blot analysis. Cells were treated with medium (control), TGF-β and TGF-β+ propolis overnight, and cell lysates were prepared using RIPA buffer. The protein bands from one representative experiment are shown for the expression of α-SMA, collagen type I and GAPDH (loading control) (A). The expression of α-SMA and collagen type I was normalized to GAPDH protein levels. The results are expressed as the means ± SEM of the normalized values of α-SMA and collagen type I. The accumulated data of ten mice from each group are shown from medium-treated cells (open bars), TGF-β-treated cells (closed black bars) and TGF-β+propolis-treated mice (hatched bars) (B). *P<0.05 for TGF-β-treated cells versus control. #P<0.05 for TGF-β+propolis-treated cells versus TGF-β-treated cells. (ANOVA with Tukey's post-test). The potential of propolis to induce the apoptosis or necrosis of HSC-T6 cells was determined by flow cytometry based on their PI/Annexin V staining patterns. A dot plot of one representative data set from 10 independent experiments (n=10) is shown (C). Accumulated data from ten mice from each group are expressed as the mean percentage of apoptotic cells ± SEM for TSC-T6 cells treated with medium (control) (open bar) and propolis-treated cells (hatched bar) (D). The caspase-3 and caspase-9 activity levels were evaluated in TSC-T6 cell lysates using a fluorometric protease assay (E). The data of ten mice from each group are presented as the mean ± SEM. *P<0.05 for propolis-treated cells versus control cells (ANOVA with Tukey's post-test).